Population Distribution in North America
The United States population is nearly 330 million as of 2020. Canada now has over thirty-four million people. The US population is growing by about 2.5 million people each year. A little less than half the growth can be attributed to immigration and the rest to birth rates. The pace of growth is slower than the world average but more rapid than many other industrialized countries such as those in Europe.
The population is not uniformly spread over North America, nor are the population growth rates the same in all locations. Most Canadians live near the US border. The North American population tends to be clustered in cities, with about 80 percent of US citizens residing in urban/suburban areas. Additionally, over time, the population has been moving southward and westward. The US states experiencing the greatest rates of population growth include those located on the southern portion of the eastern seaboard, as well as Texas, Nevada, Utah, California, Oregon, and Washington. Three states, California, Texas, and Florida, accounted for about a third of the entire US population growth since 1990. Still, the Northeast is the most densely populated area of the country thanks, in large part, to the megalopolis that forms the corridor and encompasses the cities from Washington, DC, north to Boston. The largest concentration of Canadians lives in the most southern-reaching province of Ontario. For this reason, the province of Ontario is often referred to as South Canada.
United States Census
In general, the population of minorities is growing most rapidly. Some of the fastest-growing populations in the United States are Hispanics. Another interesting factor in population growth is the increase in life expectancy. As more people live longer, the growth of the segment of the population aged sixty-five has doubled in the last fifty years. However, it appears that the growth of this population segment is slowing. Of this group, the most significant increase was seen in people aged eighty-five years and older.
The American population tends to be on the move. The United States Census Bureau data show that the average American moves once every seven years; these data further predict that about forty million people move each year (US Census Bureau). Data also indicate that Americans will move to a metropolitan area. Urbanization has been a trend since about 1950. Until that time, most Americans lived in small towns or more rural settings. The population density of the cities, and especially the suburban areas, has grown steadily since that time, bringing about a rural-to-urban population shift. Now a significant majority of people in North America live in suburban areas.
Urbanization has brought some challenges. The layout of these areas often makes owning a car a necessity; thus, traffic congestion is a significant problem in many suburban and urban areas. Other issues that have arisen are overcrowded schools, racial tensions, and a widening economic gap between the wealthy and impoverished. As people move to the cities, housing and other resources might not be able to meet demand, forcing prices upward. The gap between the cost of living in an urban area and the population’s ability to pay has contributed to poverty and homelessness. Environmental issues also abound, including how to reduce or eliminate smog, manage waste, and ensure adequate clean water supplies.
Migration Patterns
The United States has not only undergone a massive rural-to-urban shift in its population; intermigration within the United States from one region to another has also been prevalent. Each of the US regions has witnessed changes in demographics because of migration patterns.
In the agricultural regions of the United States, such as the Midwest, the migration pattern has been caused by changes in farm technology. Portions of the United States were opened up for agriculture because of the Homestead Act of 1862, where each person could receive 160 acres from the government to start a farm. They could keep the acres if they lived on them and farmed them for years. In the 1800s, 160 acres was enough land to support a family if conditions were appropriate. The Industrial Revolution brought about improved farm equipment and technology. Larger and more expensive tractors and improved farming methods pushed the small farmers to sell out. Farms increased in size, and fewer people were required to operate them. Since fewer farm workers are needed in rural areas, there has been a major rural-to-urban shift in the population. Central cities are increasing in population, while small towns and rural areas in the Midwest and across the nation are decreasing in population.
Urban Development
North America’s urban landscape has been shaped both by colonization and by industrialization. Most of the early settlements in the region were small and were located close to the eastern coast. The Appalachian Mountains provided a formidable obstacle for early settlers before 1765. As settlement and colonization expanded, people moved steadily westward, still primarily situating close to waterways. Even today, most urban centers are located close to water.
During this time, immigration and natural growth expanded North America’s population. In 1610, the population of what is now the United States, excluding indigenous groups, was a meager 350 people. In just 200 years, the population reached over 7 million. In 1620, just 60 people occupied what is now the Canadian city of Quebec. Today, the population of the United States stands at over 330 million, and Canada’s population is over 35 million, and both countries are highly urbanized.
North America’s cities themselves have also changed over time. The traditional North American city had a core commercial area, called the central business district (or CBD), surrounded by worker’s homes. Density was generally highest near the city center and decreased as you traveled outward away from the urban center and into the rural areas.
As deindustrialization occurred, suburbanization replaced the previous rural to urban migration. The rush to move to the city center for jobs in industry was replaced by the desire for more land and spacious, single-family homes. With the decrease in housing density and the increase in both home size and acreage, however, came sprawl. Urban sprawl refers to the expansion of human settlements away from central cities and into low-density, car-dependent communities. Sprawl is associated with urban decentralization, the spreading out of the population that resulted from suburbanization. Counter urbanization, the shift in populations from urban centers to suburban and rural settlements, has been prevalent in North America since the end of World War II. In some areas, rural populations have grown as a result of counter urbanization. As sprawl continued, edge cities developed. An edge city is an urban area situated outside of the traditional central business district.
In historical North American cities, the central city was home to most of the jobs and services and had relatively high-density housing. Because everything was located close to the city center, people could often walk from home to work or take efficient transit systems like streetcars. Urban decentralization has not only resulted in sprawl but has also created suburbs that are entirely dependent on automobiles.
Few suburbs have shops or restaurants, and most people living in the suburbs have to commute to work. Since jobs are no longer clustered in the city center, cities have faced challenges trying to develop mass transit systems that tie together numerous disconnected suburban developments and link people with their places of work, many of which are now located in surrounding edge cities.
Toronto, for example, Canada’s largest city, has a population of 2.8 million within its city limits. Its surrounding suburbs, however, have grown considerably in recent decades. The entire metropolitan area now has a population of over 5.5 million and the average daily commute time is over 1 hour. To the south, Washington, DC’s urban decentralization has extended north into Maryland and south into Virginia. Its subway system, a technological marvel when it opened in 1976, has not kept pace with its urban growth and numerous sections of rail lines were shut down for an extended period in 2016 and again in 2019 to conduct major system and station repairs.
In some areas, the metropolitan area has grown so large that it overlaps with neighboring metropolitan areas. This is referred to as a megalopolis. The Northeast Megalopolis extends along the Interstate 95 corridor from the southern suburbs of Washington, DC north through Baltimore, Philadelphia, and New York to Boston. It covers about 2 percent of the land area in the United States but is home to over 50 million people, around 16 percent of the US population. It is projected to grow to 58 million people by 2025. The Northeast Megalopolis is just one of many growing urban areas in North America. The Atlanta Metropolitan area may one day extend into Charlotte, North Carolina. Toronto’s urban development may creep south, intermixing with development in Detroit, Cleveland, and Chicago. Florida may one day become one megalopolis linking the cities of Tampa, Orlando, Miami, and Jacksonville. These massive urban settlements will provide new opportunities for creative housing and transportation planning.
One creative approach to the problem of urban sprawl is New Urbanism, a movement to create urban landscapes with walkable neighborhoods, accessible public spaces, and housing and shops nearby. In the United States alone, more than 600 towns and villages have been developed following the New Urbanist principles. Celebration, Florida, for example, near Orlando was designed and built by the Walt Disney Company and includes a variety of apartments and single-family homes close to shops, restaurants, and a movie theater – all of which are within walking distance for residents. In other areas, New Urbanism is more broadly integrated into long-term urban plans. One criticism of New Urbanist developments is that while on the surface, they promote mixed-income developments, in practice, most housings in these areas are for the middle and upper classes. Housing prices in these developments are simply beyond the reach of many low-income families.
As urban to suburban migration continued, some desired instead to move back from the sprawling suburbs to be closer to the amenities of the downtown area. This often led to gentrification, where increased property values displace lower-income families and small businesses. Initially, low-income, historic housing near the city center attracted middle- and upper-income families. As these families moved in and renovated the housing, other families did the same. Over time, this renovation increased property values – an advantage for city officials who saw an increase in property tax revenue. For the poorest in the communities, however, this increase in property values often meant that they could no longer afford to rent near the central city. Given the auto-dependency of the sprawling suburbs, where would someone live if they had no transportation and worked in the downtown area? The walkability of the downtown, an amenity for those relocating from the suburbs, was often a necessity for low-income workers.
Gentrification also changes the racial and ethnic makeup of neighborhoods, as most people moving into these changing urban areas are typically white. The Bedford- Stuyvesant area of Brooklyn, for example, was traditionally an African American community but beginning in the 2000s, began to experience gentrification. The percentage of white residents increased from 2.4 percent in 2000 to 22 percent in 2013. Median home prices jumped, too, from $400,000 in 2011 to $765,000 in 2016. New businesses have located in the area, and gentrification has funded significant infrastructure improvements. For the neighborhood’s poorest residents, however, these improvements have pushed housing and rent prices beyond what they can afford.
Immigration
Early immigration to America was dominated by people from the British Isles, resulting in an American population for whom speaking English and practicing Protestant Christianity was the norm. There were some regional exceptions to this, such as Catholicism in Maryland and the widespread speaking of German in Pennsylvania, but by and large, English and Protestantism were standard in the American colonies. As migrants arrived in the United States from non-English-speaking countries, within a generation, they learned English and assimilated into American society, giving rise to the idea of the United States as a cultural melting pot. People were drawn to the United States by the hope of economic opportunities; most immigrants were poor and came to the United States to make a living and improve their financial well-being. They viewed assimilation into mainstream society as a necessity for success. They believed in the American Dream, that through hard work, someone could achieve upward mobility and financial success no matter their background. The dream came true for millions of Americans but remained out of reach for many who live in poverty.
As of 2019, the United States Census Bureau estimates that there are approximately 330 million people and was the third-most populated country in the world after China and India. Among developed countries, the US population is one of the fastest-growing, at about 1 percent each year. This is thanks to a fertility rate of about 2.1 that is higher than the 1.5 for that of most European countries, as well as a positive net migration rate (more people immigrating to the United States than emigrating from it). In terms of human well-being, life expectancy is more than seventy-eight years for men, and the average woman can expect to live for more than eighty years. While this may seem high, especially when compared with a century ago, life expectancy in the United States is lower than in forty-nine other countries.
Although English has remained the dominant language, as a country of immigrants, the United States is home to people from all corners of the world and home to many cultural or ethnic minority groups. According to the 2010 census, the ethnic minority groups in the United States included 16.3 percent Hispanic (who can be of any race); 12.6 percent black or African American; 5.0 percent Asian and Pacific Islander; and 1.0 percent Native American (American Indians, Eskimos, and Aleuts) (US Census Bureau). An interesting trend is that Asians are growing faster than any other ethnic group in California, the nation’s largest state. The 2010 census reported that the Asian population in California had increased 31.5 percent since 2000 to a total of five million.
Hispanic Population
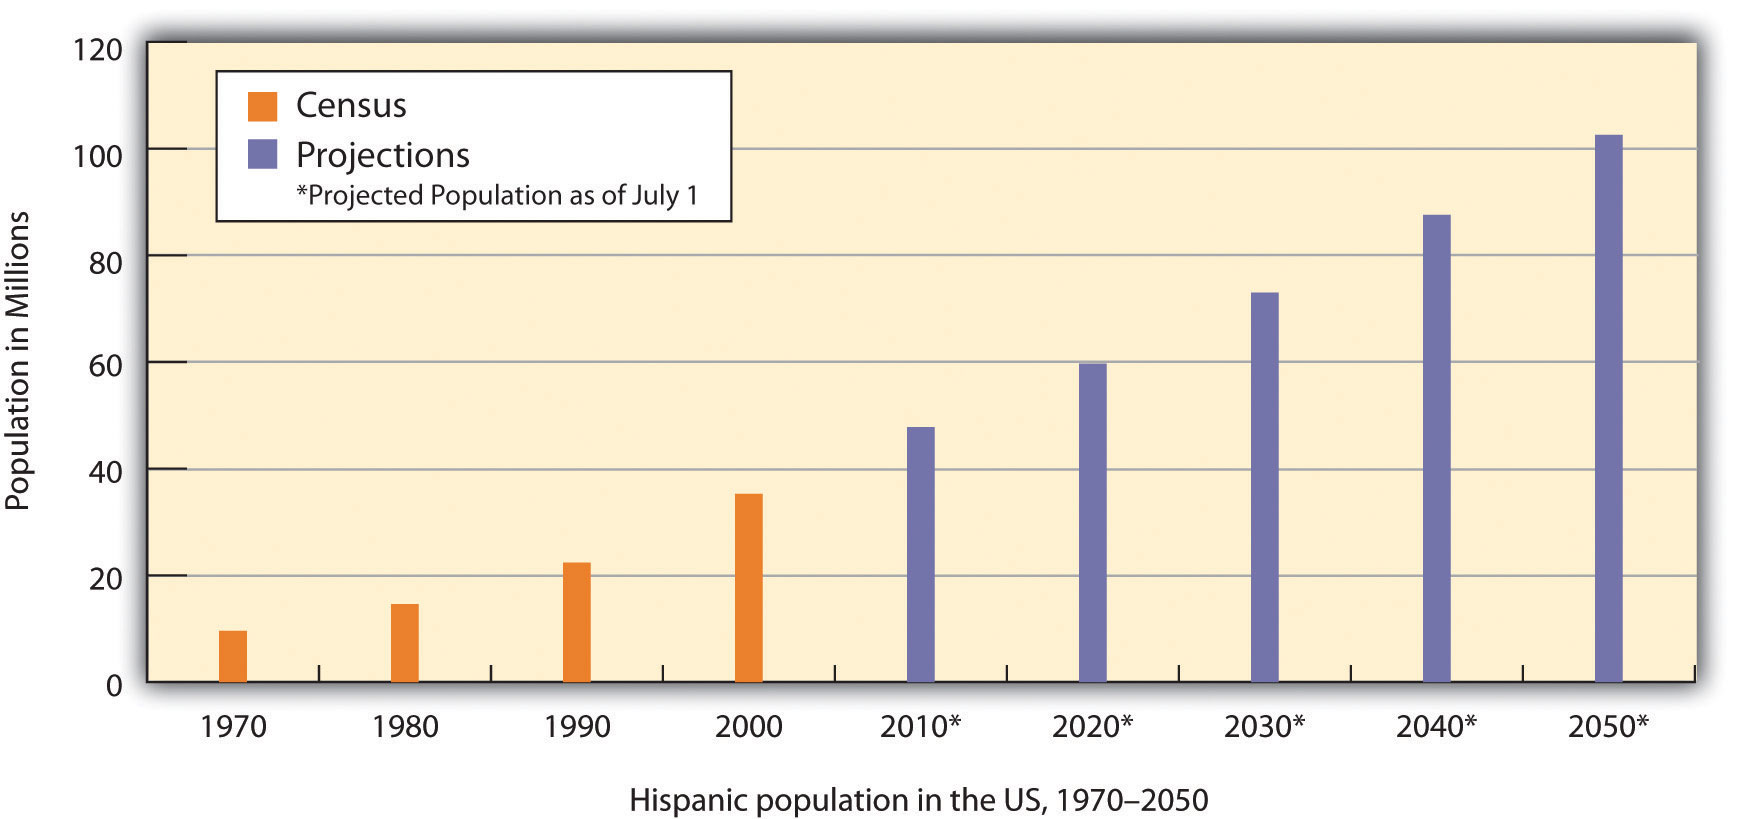
One of the most striking shifts in immigration patterns of the past few decades has been the dramatic increase in Hispanic/Latino immigrants to the United States. While there have long been Spanish speakers living in the United States (recall that Spain colonized Florida, Texas, and the Southwest before those regions became part of the United States), for most of American history the Hispanic minority had little impact outside of a few areas of the country. In 1970, Hispanics made up less than 5 percent of the US population, but by 2010, forty-eight million Hispanics made up about 16 percent of the population. For the first time, Hispanics were the largest ethnic minority in the United States, surpassing blacks as the most significant minority starting with the 2000 US census (12.5 percent Hispanic compared with 12.3 percent black). The US Hispanic population doubled between the 1990 and 2000 censuses. Between 2000 and 2006, Hispanic population growth accounted for about half the nation’s growth and grew about four times faster than the country’s population as a whole.
The growth of the US Hispanic population is a direct result of increased immigration from Latin America to the United States in the late twentieth and early twenty-first centuries and the Hispanic population having higher fertility rates than the non-Hispanic US population.
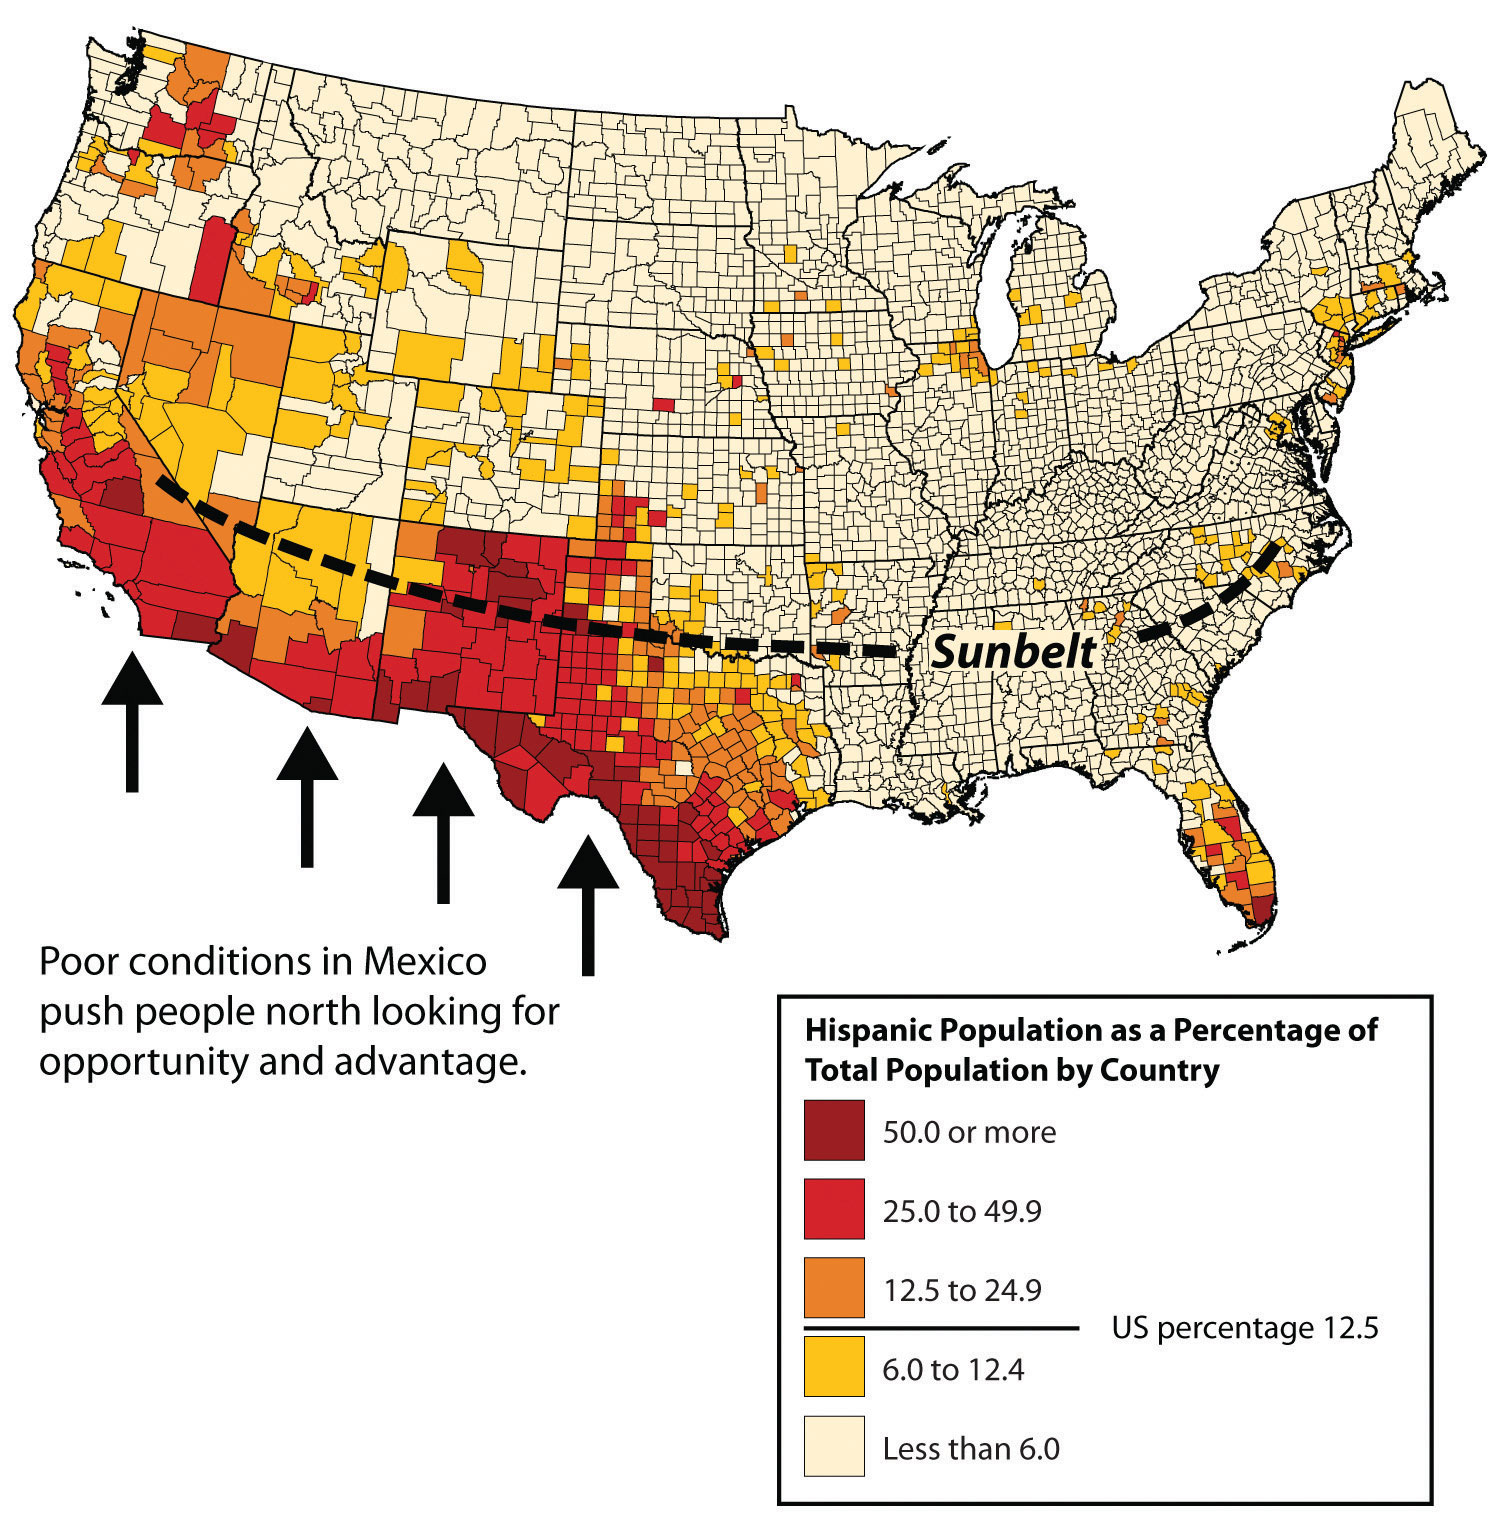
Nearly half the Hispanics in the United States live in California or Texas, although there has been a substantial increase in the Hispanic population outside those states in the past decade, especially in the South. For example, Arkansas, Georgia, Tennessee, and North and South Carolina all experienced Hispanic population growth rates between 55 and 61 percent from 2000 to 2006. All regions of the country saw double-digit growth rates of their Hispanic populations during that time. In places such as California, the large Hispanic population has an especially significant impact on the economy, politics, and every aspect of social life: more than one-third of Californians are Hispanic (37 percent), while 42 percent are non-Hispanic whites, and a much smaller minority are African American (7 percent).
Who are the Hispanics living in the United States? Most were born in the United States (60 percent), while the rest are immigrants. Two-thirds are either from Mexico or of Mexican descent, while others hail from the US territory of Puerto Rico, Cuba, or the Dominican Republic. Note that all Puerto Ricans are US citizens and can move to and from the US mainland without any special documentation requirements. More Hispanics come from Central America than from South America. Hispanics work in all professions but are found in professions such as agriculture, construction, and food service at higher rates than the country’s non-Hispanic population.
The draw of opportunities and advantages has always pulled people toward the United States. While many of the Latin American immigrants enter the United States legally, according to the US Department of Homeland Security’s Office of Immigration Statistics, about 10.8 million undocumented immigrants were residing in the United States as of 2010; 62 percent are from Mexico (US Department of Homeland Security). This number is lower than it was in previous years, possibly because of the economic recession and higher-than-usual rates of unemployment. The US-Mexican border is about 1,970 miles long and runs through an arid and open region between the two countries. It is difficult to control the illegal immigration across this border, as the attraction to American jobs is so compelling that people will risk death to cross the deserts of the Southwest. According to 2010 estimates, undocumented workers make up about 5 percent of the United States’ civilian workforce, including approximately 24 percent of the agricultural workforce.
The amount of remittances sent from undocumented workers in the United States to Mexico is estimated in the billions of dollars. The remittances from Mexican nationals living outside Mexico and sending money home to their families are Mexico’s second-largest source of foreign income. Without remittances, many Mexican families would have a difficult time making ends meet.
African American Population
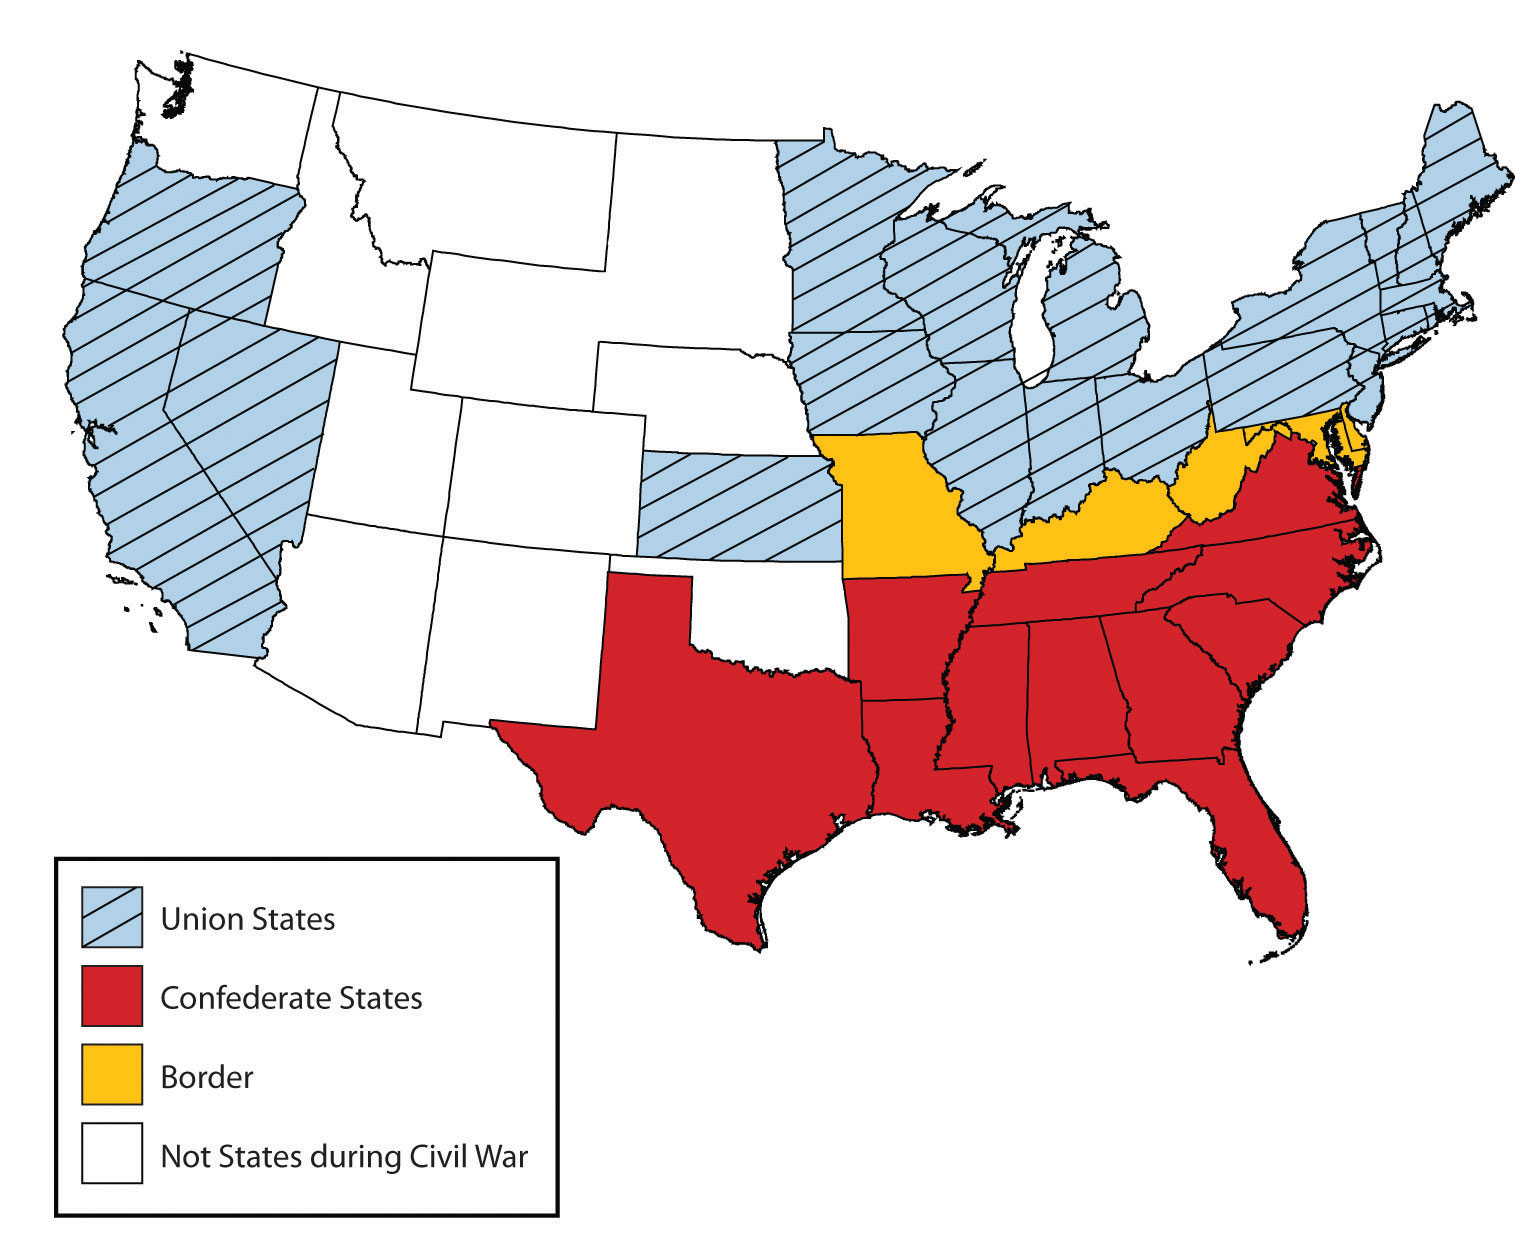
Most African Americans were concentrated in the South before the Civil War, where they worked as slaves in the cotton and tobacco plantations that supported the region. In some counties, blacks made up most of the population, and this did not change when the war was over. Many of the newly freed slaves remained as poor agricultural workers in the South well into the twentieth century. Even as late as 1910, seven out of every eight African Americans lived in the South.
In the late nineteenth and early twentieth centuries, as the industrialization of northern cities was accelerating, the increased need for factory workers was primarily met by immigration from Europe, especially from southern and eastern Europe. However, when the First World War began (1914), European immigration began to slow down. European immigration then nearly ground to a halt in the 1920s as Americans set quotas in place to reduce the number of Eastern European immigrants. At that time, the factories in the Manufacturing Belt continued to need workers, but instead of European workers, they recruited African Americans from the South.
This led to a massive migration of blacks from the South to cities of the North and West. This migration was so significant to African Americans in the United States that it is called the Great Migration. Between 1910 and 1925, more than 10 percent of African Americans made the journey north, and even more followed. Examining a map of the distribution of African Americans today shows the legacy of the Great Migration, as blacks live in many parts of the United States, both in the South and in postindustrial cities of the north and the Midwest. Blacks also now live in Sun Belt cities, as people of all races look for jobs related to the new information technologies and service industries.
Sanctuary Cities
There has been a lot of debate in the United States regarding sanctuary cities. Sanctuary cities are cities that choose to not cooperate with federal law enforcement to enforce immigration law. Rather, local government officials within sanctuary cities state they want to reduce deportation and family separation among undocumented people living within their cities. The hope is that undocumented people will, therefore, be willing to work with law enforcement officers to report crimes, use health and social services, and enroll their children in school.
In the United States, municipal policies include prohibiting police or city employees from questioning people about their immigration status and refusing requests by national immigration authorities to detain people beyond their release date, if they were jailed for breaking local law.
Religion in the United States
Most early settlers to the United States were Protestant Christians: Puritans lived in New England and Anglicans (later called Episcopalians) lived in Virginia. Roman Catholic immigrants settled in Maryland, and members of the Society of Friends (Quakers) founded Pennsylvania. Even within that overall picture, there was a great deal of religious diversity in the United States, and that diversity increased as new arrivals came from different countries with different religious backgrounds. The current pattern of religious affiliation in the United States remains quite complex, and one can find observers of nearly every dominant religion, and many minor ones, in virtually every area of the country. That being said, there are clear patterns to the geography of religion in the United States that tell stories of immigration and migration history, as well as stories about other aspects of American history.
The most striking feature of the map below is the block of red in the Southeast in which Baptist churches are the leading church body. Although Baptist churches are the leading religious body in about 45 percent of all counties in the United States, most of those counties are found in the South. This region is considered the nation’s Bible Belt, and it is a region in which churches are more likely than in other parts of the country to teach a literal interpretation of the Bible. Baptist churches grew in popularity in the South after the Civil War as more liturgical denominations such as Methodists went into decline, and Baptist churches are popular among both African American and white residents.
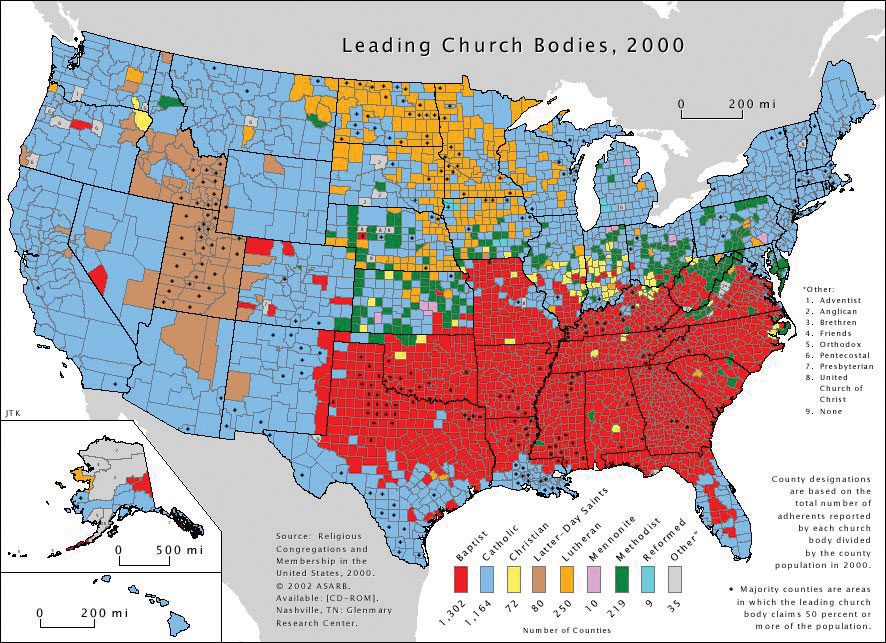
Another interesting Protestant region is northern Appalachia and the lower Midwest from Ohio to Iowa and Kansas. As seen on the map, some of these counties are Baptist, in some of them the strongest church presence is Methodist, and in others, it is Christian churches (Disciples of Christ and historically similar denominations) that prevail. The Methodist and other Christian areas were heavily influenced by the Second Great Awakening of the early nineteenth century, which promoted the theology that every person could be saved through revivals. The movement provided for strong showings of Protestant denominations that arose during that time. The third Protestant region is the northern Midwest and Great Plains: Minnesota, the Dakotas, and surrounding areas. This was the destination of German and Scandinavian Lutheran settlers during the late nineteenth and early twentieth centuries, and the leading denominations today in much of that area remain Lutheran.
The Roman Catholic Church, which is the leading religious body in 40 percent of US counties, is well represented in the Northeast, West, and Southwest. In the Northeast and Midwest, Catholic dominance points to nineteenth- and early twentieth-century immigration from Roman Catholic countries in Europe such as Italy, Ireland, and Poland. Those earlier Catholics have been joined more recently by large numbers of Hispanic immigrants. The dominance of Roman Catholics in the western United States, the Southwest, and even Florida in the Southeast are a reflection of the strong Hispanic presence in those parts of the country.
In the western United States, the Church of Jesus Christ of Latter-Day Saints (Mormon church or LDS) dominates a region including Utah and surrounding states. Utah was the destination of Mormon members as they migrated westward during the mid-nineteenth century.
Major urban centers are home to people who follow all the major religions of the world. Muslim populations are found in cities as a result of late twentieth-century immigrants arriving from countries such as India, Pakistan, and places in the Middle East and moving to urban areas for employment. Detroit and its surrounding counties in southeastern Michigan are one part of the country with a high concentration of Muslim immigrants.
Economic development
To understand economic geography, all economic activities can be grouped into one of four categories, each with its respective terms, depending on the nature of what is being produced:
- Primary economic sector activities include everything that pertains to the collection of raw materials, such as agriculture, forestry, fishing, and mining—in other words, growing and extracting activities.
- Secondary economic sector activities involve the processing of those raw materials through manufacturing, which has been the mainstay of economic growth for most developed countries.
- Tertiary economic sector activities are those that produce services, not physical products.
- Quaternary economic sector activities are those that deal with information collecting and processing, as well as management.
The tertiary and quaternary economic sectors are often thought of together as the service sector. In the explanation of how countries gain national income (Section 1.4 “Globalization and Development”), only primary and secondary activities produce actual physical products, and manufacturing traditionally earns the highest value-added profits. Tertiary activities are selective in gaining national wealth. For example, service activities such as tourism can bring in national wealth if the visitors are from outside the country. Tourism within a country can also influence economic conditions by increasing the amount of consumer spending.
During the colonial era and into the nineteenth century, when the majority of Americans lived on farms and worked in agriculture, most economic activity in the United States took place within the primary economic sector. Today, the primary sector is still an essential component of the US economy, but far fewer people are employed in it. For example, less than 1 percent of Americans make their living by farming, but agricultural output has continued to grow because of advancements in mechanization and the development of high-tech seeds, fertilizers, and pesticides. The United States has been able to export surplus agricultural output to other parts of the world. Fewer people work in coal mines than in the past, but because of new mining technologies and methods such as mountaintop removal, coal production remains high.
The geographic distribution of primary activities depends both on the location of natural features such as physical geography and climate and on the location of the market for a particular crop or resource. The nineteenth-century German economist Johann von Thünen created a model that predicted land use around a central market. In his theory, land closest to the market would be used to produce crops that were expensive to transport, such as dairy. Land far from the market would be used for the production of crops that were less expensive to transport and less perishable, such as grain. The von Thünen model predicts a series of concentric rings surrounding a central market, with each ring producing a different kind of crop. If the von Thünen model is applied at a much larger scale to the United States as a whole, with the densely populated urban zone from Boston to Washington, DC (called a megalopolis), used as the central market, the model does a reasonably good job predicting the United States’ agricultural land use. Dairy farms are found close to the market, grain farms are farther away, and ranch lands used for livestock production are even farther away.
Anything that involves the processing of raw materials, such as manufacturing, is a secondary activity. As the United States moved into the Industrial Revolution and the mid-twentieth century, the percentage of the US workforce involved in manufacturing grew from almost nothing until it peaked in the late 1970s. It was the main area of economic growth for decades. Although manufacturing was present in most areas of the country, it was focused in the northeastern United States and along the Great Lakes. Factories were close both to the reserves of labor and to the markets for manufactured products found in the densely populated Northeast. The steel industry was located in Pittsburgh and its environs because of the area’s access to iron ore (mined in Minnesota and transported via the Great Lakes) and to coal (mined in Pennsylvania, West Virginia, and other parts of Appalachia).
https://www.youtube.com/watch?v=biZvs5KApIw
As manufacturing has grown in other parts of the world, the secondary economic sector has declined in the United States. US labor statistics indicate that the United States lost about five million manufacturing jobs between 2000 and 2010 (Nance-Nash, S.). Many of these jobs were lost to countries with lower labor costs, such as Mexico or China.
The third group of economic activities takes place in the tertiary and quaternary sectors, commonly known as the service sector. Tertiary and quaternary activities create services, not physical products. Service jobs include everything from engineering to finance, restaurants to sports, and childcare to medicine. The tertiary sector makes up more than three-quarters of the US economy, as measured by its share of the gross domestic product (GDP), which is the total value of all goods and services produced in a country in a given year. The GDP is then divided by the country’s population to provide a GDP per capita statistic.
The United States has shifted to a post-industrial service economy. The rise of the information age in the latter part of the twentieth century shifted the workforce into the information sector. By the start of the twenty-first century, less than 2 percent of the US workforce was employed in agriculture, 15 percent in industry, and the rest in services (18 percent) and information activities (65 percent).
The locations of service-sector jobs are much more flexible than are jobs in the primary or secondary sectors. They are called footloose jobs: an accountant can live in New York or Denver, whereas it is much more difficult for factories to move from one place to another and it is impossible for farms to relocate. Many of the information-technology jobs are emerging in the southern regions of the United States called the Sun Belt. Southern cities such as Atlanta, Dallas, and Phoenix are centers of innovation and population growth. The warmer climate, combined with a lower cost of living and less congestion, makes the Sun Belt an attractive location for emerging information-based companies. Note that the popularity of the South and West for service-sector jobs only came about after the invention and adoption of air-conditioning. Air-conditioning was not widespread until after the Second World War in the 1950s.
While the population of the Southern states has increased, the population of some Northern states has decreased. The Sun Belt has always been a destination for people escaping the harsh winters of the Northern states. This has usually been only a seasonal transition. However, the new trend is one of continual growth because of the increase in information technologies and the service industry. Emerging companies looking to establish their businesses have targeted major cities from the Carolinas to the Southwest.
